How measuring Customer Experience can predict business growth
We’ve talked previously about the importance of customer experience so hopefully you have an understanding about why we place an emphasis on this area. Essentially, if you design your purchasing experience with the customer at the heart (ensuring not just a seamless experience but one that is memorable and worth sharing) profit should be a well-earned by-product. Customers will return and they will tell their friends, leading to increased revenue and business growth. Here we take a look at some of the research in this area and discuss how we can measure the impact of Customer Experience to forecast future business growth.
Why measure Customer Experience?
We believe strongly in the adage “you can’t improve what you can’t measure!” Gaining insight from your customers on their experience is critical if you’re going to make your organisation more customer-centric with the aim of building loyalty and advocacy. However, any information gathered needs to be of use. Quantitative data is useful to be able to ascertain a way of measuring the impact of any changes. However, on their own, numbers (the “what”) can be limiting as they don’t tell you the “why.” Therefore, we need to combine this with qualitative information – gaining feedback from customers about what they did and didn’t enjoy about the experience and why.
There are a number of ways companies can measure customer experience – Customer Satisfaction Score, Customer Churn Rate, Customer Effort Score (CES), Average Resolution Time, to name some. We choose to primarily measure customer experience through Net Promoter Score (NPS) as it provides us both the “what” and the “why” and it allows a customer’s experience can become tangible, measurable and actionable. Research has also proven its ability to predict business growth – something we feel is useful!
The History of NPS and how it can predict future business growth
NPS was designed by Fred Reichheld in 2003 to measure customer experience and predict its impact on the future of a company. Reichheld devised the NPS model based on his experience with Andy Taylor, the CEO of Enterprise Rent-A-Car, who had started polling their customers with just two simple questions – about the quality of their experience and whether they would recommend the brand. In his pioneering Harvard Business Review article, Reichheld states “By concentrating solely on those most enthusiastic about their rental experience, the company could focus on a key driver of profitable growth: customers who not only return to rent again but also recommend Enterprise to their friends.”
Reichheld evolved Enterprise’s system over two years of research – ensuring that his focus was on a model that could be closely linked to predicting business growth and profitability. He found that the percentage of customers who were enthusiastic enough to refer a brand (a strong sign of customer loyalty) correlated directly with growth rate of a business – and could be applied across most sectors.


The London School of Economics has since backed up this research and discovered a correlation between NPS increase and revenue growth. According to them, an average NPS increase by 7 points correlates with a 1% growth in revenue.
In addition, Temkin research found that promoters are 4.2 times more likely to buy again, 5.6 times more likely to forgive a company after a mistake and 7.2 times more likely to try a new offering compared with the detractors.
So, what exactly is Net Promoter Score?
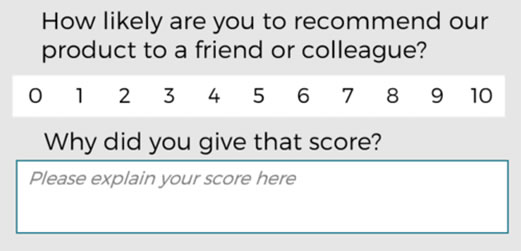
At Redfish we use NPS as it’s easy to implement, simple for customers to understand and provides a clear means of measurement as well as action-points to follow up on. It is a key component of our customer experience offering and allows us to measure the impact of improvements we make so we’re accountable for our actions. It consists of 2 questions, allowing us to get both quantitative and qualitative data about customers’ feelings.

- Promoters – Score 9 or 10 – Loyal customers who share positive experiences with ones around them
- Passives – Score 7 or 8 – unlikely to recommend brand and if they do it’s with caveats and little enthusiasm
- Detractors – Score 0 – 6 – had a bad experience and talk negatively about the company
To calculate the score, you subtract the percentage of Detractors from the percentage of Promoters. Passives count toward the total number of respondents, therefore decreasing the percentage of detractors and promoters, pushing the final score towards 0. An NPS score is given between -100 and 100. Generally, a ‘good’ NPS score is anything above 0, though obviously the closer a company gets to 100, the better.
The second question provides us more detail to understand why they gave that score and provides actionable information designed to aid decision-making on the next phase of customer experience improvements.
NPS provides opportunity to segment and personalise
NPS doesn’t just provide us with information to be able to improve the customer experience. We are also able to align the data with your customer database, therefore providing you with an additional choice for data segmentation. From this you can identify those customers more likely to promote your business and those unsatisfied customers who may be ‘at-risk.’ You can then implement tailored marketing and promotional strategies designed to meet different objectives.
Interested to learn more?
To find out more about how we can help your business with customer experience, loyalty or marketing strategies, please get in touch. We’d love to talk!
References:
Harvard Business Review by Frederick F. Reichheld
https://hbr.org/2003/12/the-one-number-you-need-to-grow
The London School of Economics Advocacy Growth Study 2005


